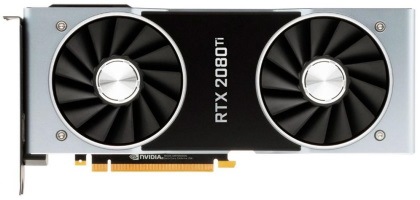

一般信息
显卡比较列表中的一般信息部分包含发布日期、类型、总体评级和其他有用的数据,以确定AMD Radeon R7 240和NVIDIA GeForce RTX 2080 Ti之间的胜负。请注意,比较是全面的,下面是来自合成基准的排名,定义了游戏和工作应用中的不同标准。
技术数据
在制造工艺、功耗、基础和涡轮增压GPU频率方面,AMD Radeon R7 240 与 NVIDIA GeForce RTX 2080 Ti 相比,哪个显卡更好,是显卡排名中包含的最重要部分。
尺寸、连接器和兼容性
让我们讨论图形卡AMD Radeon R7 240}和NVIDIA GeForce RTX 2080 Ti}}}}}}的图形卡AMD Radeon R7 240}。
内存(频率和超频)
显卡内存在游戏和图形应用中都发挥着重要作用。标准越高(GDDR)越好。它对速度和处理效率有直接影响. AMD Radeon R7 240 和NVIDIA GeForce RTX 2080 Ti 之间在类型、基础和涡轮频率、GDDR带宽方面有什么区别:
支持端口和显示器
让我们讨论图形卡AMD Radeon R7 240和NVIDIA GeForce RTX 2080 Ti的图形卡AMD Radeon R7 240。
技术
让我们来看看有什么区别。值得注意的是,NVIDIA和AMD使用的是不同的技术。
API 支持
两个对手 AMD Radeon R7 240 和 NVIDIA GeForce RTX 2080 Ti 之间的战斗即将结束。硬件支持(API)对整体性能影响不大,它在合成基准和其他性能测试中没有被计算在内。
游戏中的表现
选择列表以识别 AMD Radeon R7 240 和 NVIDIA GeForce RTX 2080 Ti 图形卡. 结果显示游戏将运行的速度以及是否可以在此计算机上运行。不同的监视器分辨率(从低到4K)用于测试。 找出是 AMD Radeon R7 240 查明是否 NVIDIA GeForce RTX 2080 Ti 适合游戏的
|
low
1280x720 |
med.
1920x1080 |
high
1920x1080 |
ultra
1920x1080 |
QHD
2560x1440 |
4K
3840x2160 |
||
| Horizon Zero Dawn (2020) | AMD Radeon R7 240 | ||||||
| NVIDIA GeForce RTX 2080 Ti | 159 | 146 | 133 | 115 | 94 | 54 | |
| Death Stranding (2020) | AMD Radeon R7 240 | ||||||
| NVIDIA GeForce RTX 2080 Ti | 174 | 173 | 170 | 169 | 133 | 78.8 | |
| F1 2020 (2020) | AMD Radeon R7 240 | ||||||
| NVIDIA GeForce RTX 2080 Ti | 289 | 247 | 240 | 202 | 162 | 100 | |
| Gears Tactics (2020) | AMD Radeon R7 240 | ||||||
| NVIDIA GeForce RTX 2080 Ti | 321 | 243 | 166 | 126 | 101 | 64.7 | |
| Doom Eternal (2020) | AMD Radeon R7 240 | ||||||
| NVIDIA GeForce RTX 2080 Ti | 315 | 290 | 266 | 259 | 204 | 113 | |
| Legend | |
| 5 | Stutters – This game is very likely to stutter and have poor frame rates. Based on all known benchmarks using the specified graphical settings, average frame rates are expected to fall below 25fps |
| May Stutter – This graphics card has not been explicitly tested on this game. Based on interpolated information from surrounding graphics cards of similar performance levels, stutters and poor frame rates are expected. | |
| 30 | Fluent – Based on all known benchmarks using the specified graphical settings, this game should run at or above 25fps |
| 40 | Fluent – Based on all known benchmarks using the specified graphical settings, this game should run at or above 35fps |
| 60 | Fluent – Based on all known benchmarks using the specified graphical settings, this game should run at or above 58fps |
| May Run Fluently – This graphics card has not been explicitly tested on this game. Based on interpolated information from surrounding graphics cards of similar performance levels, fluent frame rates are expected. | |
| ? | Uncertain – This graphics card experienced unexpected performance issues during testing for this game. A slower card may be able to achieve better and more consistent frame rates than this particular GPU running the same benchmark scene. |
| Uncertain – This graphics card has not been explicitly tested on this game and no reliable interpolation can be made based on the performances of surrounding cards of the same class or family. | |
| The value in the fields displays the average frame rate of all values in the database. Move your cursor over the value to see individual results. | |
优势 AMD Radeon R7 240
更加便宜 ($261 (3.8x MSRP) vs $1265 (1.3x MSRP))
更少的电力消耗 (50 Watt vs 250 Watt)
优势 NVIDIA GeForce RTX 2080 Ti
96.18% 在测试中更快
更多输送机 (4352 vs 320)
大的内存带宽 (12 nm vs 28 nm)
最大的RAM尺寸 (11 GB vs 2 GB)
大的内存带宽 (616.0 GB/s vs 72 GB/s)
支持G-SYNC
支持VR
多个显示器
So, AMD Radeon R7 240 or NVIDIA GeForce RTX 2080 Ti?
根据合成和游戏测试的结果,我们建议 NVIDIA GeForce RTX 2080 Ti .
AMD Radeon R7 240 versus NVIDIA GeForce RTX 2080 Ti 基准测试中的比较
基准3DMark冰风暴GPU。图形卡性能测试结果。在hitesti.com上查看3DMark Ice Storm GPU的测试结果。
基准3DMark Cloud Gate GPU。图形卡性能测试结果。在hitesti.com上查看3DMark Cloud Gate GPU的测试结果。
基准3DMark Fire Strike得分。图形卡性能测试结果。在hitesti.com上查看GPU的3DMark Fire Strike Score测试结果。
基准3DMark Fire Strike图形。图形卡性能测试结果。在hitesti.com上查看3DMark Fire Strike Graphics的GPU测试结果。
基准3DMark 11性能GPU。图形卡性能测试结果。在hitesti.com上查看3DMark 11 Performance GPU的测试结果。
基准3DMark Vantage性能。图形卡性能测试结果。在hitesti.com上查看GPU的3DMark Vantage性能测试结果。
基准SPECviewperf 12 - Solidworks。图形卡性能测试结果。在hitesti.com上查看SPECviewperf 12 - Solidworks的GPU测试结果。
基准SPECviewperf 12 - Siemens NX:显卡性能测试结果。在hitesti.com上查看SPECviewperf 12 - Siemens NX的GPU测试结果。
基准SPECviewperf 12 - 展示。图形卡性能测试结果。在hitesti.com上查看SPECviewperf 12 - Showcase的GPU测试结果。
基准SPECviewperf 12 - 医疗。图形卡性能测试结果。在hitesti.com上查看SPECviewperf 12 - Medical的GPU测试结果。
基准SPECviewperf 12 - Maya。图形卡性能测试结果。在hitesti.com上查看SPECviewperf 12 - Maya的GPU测试结果。
基准SPECviewperf 12 - 能源。图形卡性能测试结果。在hitesti.com上查看SPECviewperf 12 - GPU的能量测试结果。
基准SPECviewperf 12 - Creo。图形卡性能测试结果。在hitesti.com上查看SPECviewperf 12 - Creo的GPU测试结果。
基准SPECviewperf 12 - Catia。图形卡性能测试结果。在hitesti.com上查看SPECviewperf 12 - Catia的GPU测试结果。
基准SPECviewperf 12 - 3ds Max:显卡性能测试结果。在hitesti.com上查看SPECviewperf 12 - 3ds Max的GPU测试结果。
基准测试Passmark。图形卡性能测试结果。在hitesti.com上查看GPU的Passmark测试结果。


